

This is the best reason to learn history: not in order to predict the future, but to free yourself of the past and imagine alternative destinies. Of course this is not total freedom - we cannot avoid being shaped by the past. - Yuval Noah Harari
Observability is one of the most important concepts in the world of technology (I know it's not the first time I've mentioned it), there is a simple concept that goes “you measure what you want to improve” that is very true. Nowadays, software developers are dealing with complex systems, which can fail at any time and for any reason, Show Figure 1. They need a way to visualize what is happening within different systems, and monitoring is the answer.

I have been written many articles about observability, this article is focus in an implementation, there is no much about theory if you want to know more you can go through my olds post and learn more.
FastAPI and Open Telemetry
FastAPI is one of the most popular python frameworks these days, in my opinion is because there are alot good things happening around it and how it is alinged with a concept called Hyper modern python. OpenTelemetry is a collection of APIs, SDKs, and tools to instrument, recollect and send metrics, logs, and traces
Elastic Cloud APM + OTLP
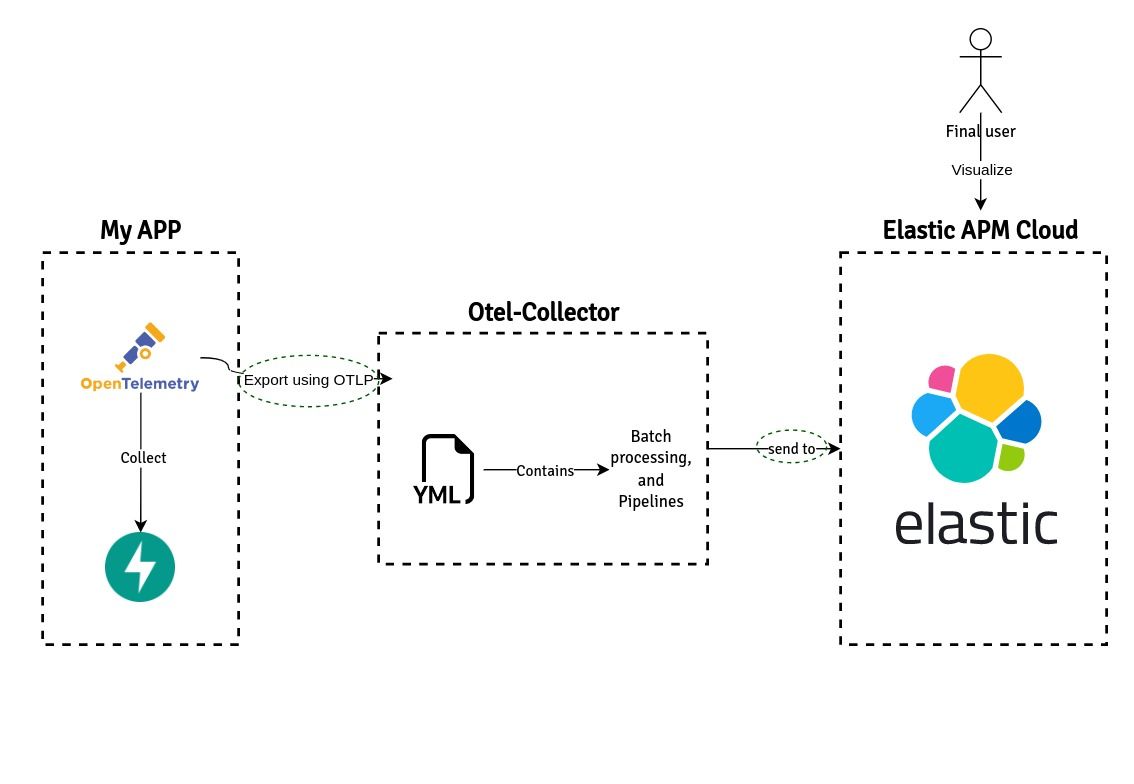
Elastic APM is a software monitoring to performance monitoring system built on the Elastic Stack (Elastisearch and Kibana). This service works saving every telemetry data from applications including databases, external HTTP request, event driven communication etc. OTLP is a protocol used by OpenTelemetry to collect metrics logs and trace. This is an interesting concept because OTLP makes efficiently the communication between the client and the Elastic Cloud APM service. Show Figure 2
Example: My app
Having defined the tools, let's go hands on. Before to start, I would like to point out that there are some additional tools like Docker and SQLALchemy that I didn't define, but you can still find information by clicking in each one.
The first step is to create an APM elastic cloud account and get the credentials (you can use the trial service), once you do that, you will have access to the dashboard Show figure 3
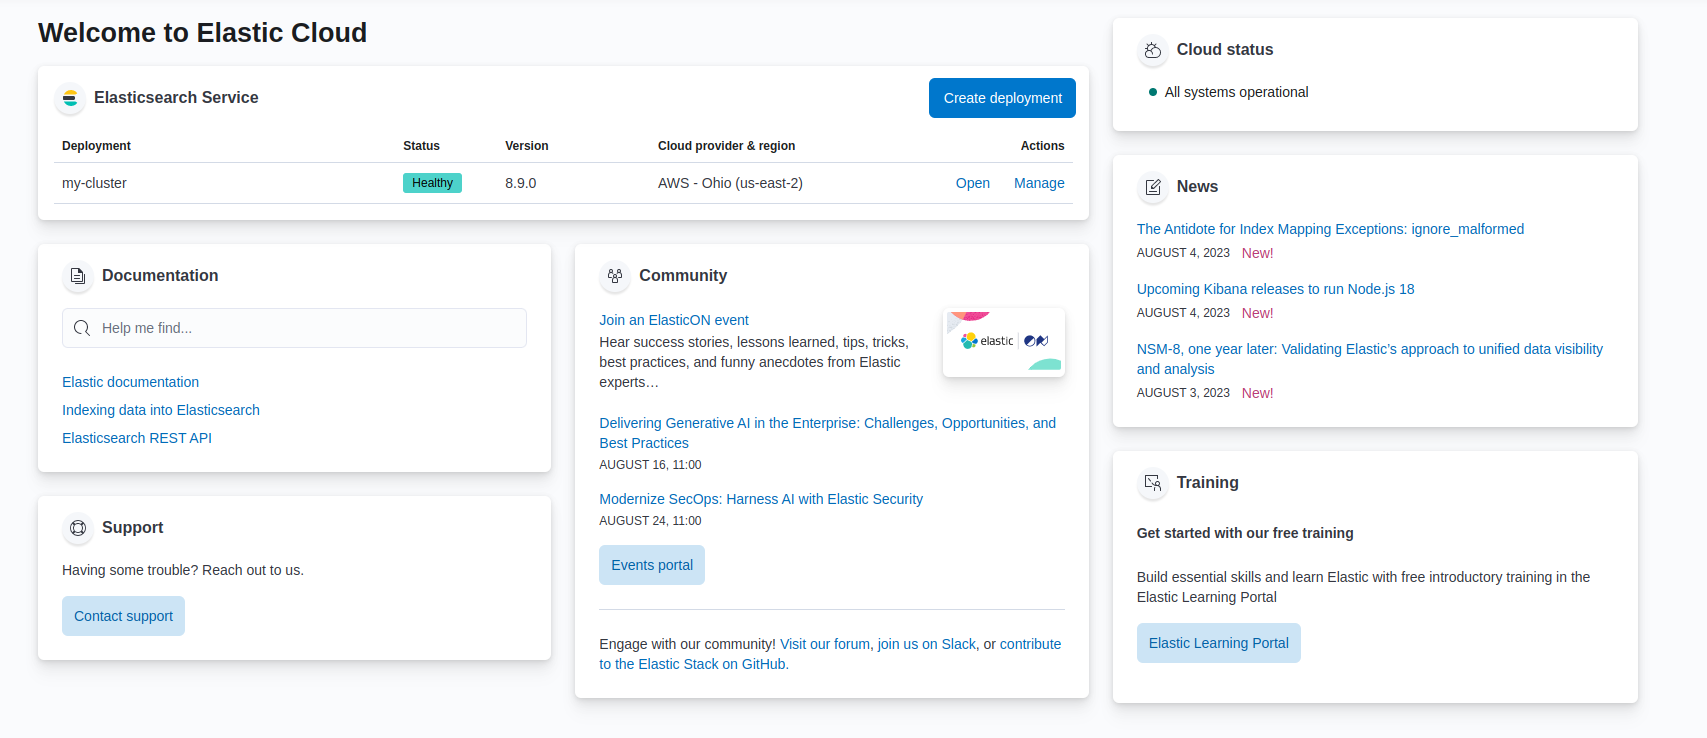
The cluster name my-cluster is basically our Elastic APM Cloud service running, going back to the Figure 2 it is where the telemetry data will be sent
The next step is to get the access credentials, the configuration file will be referenced it later, to get the credentials, click the cluster name and go to the bottom, then click in fleet > agents policies > APM agents > OpenTelemetry

Application: My app
The following example is a FastAPI application, I found a project example on GitHub and instrumented it, to follow the example easily a new repo was created.
from datetime import date
from typing import Optional
import logging
from fastapi import FastAPI
from fastapi.encoders import jsonable_encoder
from fastapi.responses import JSONResponse
from sqlalchemy import create_engine
from sqlalchemy.orm import sessionmaker

from app.models import Base, Book
from app.settings import DATABASE_URL
from opentelemetry.instrumentation.fastapi import FastAPIInstrumentor
from opentelemetry.instrumentation.sqlalchemy import SQLAlchemyInstrumentor
from opentelemetry import trace
from opentelemetry.sdk.trace import TracerProvider
from opentelemetry.sdk.trace.export import SimpleSpanProcessor
from opentelemetry.exporter.otlp.proto.grpc.trace_exporter import OTLPSpanExporter
from opentelemetry.sdk.resources import Resource


logging.basicConfig(
    level=logging.DEBUG,
    format="%(asctime)s [%(levelname)s]: %(message)s",
    datefmt="%Y-%m-%d %H:%M:%S",
)
logger = logging.getLogger("app")

otlp_exporter = OTLPSpanExporter(endpoint="localhost:4317", insecure=True)
resource = Resource.create(
    {
        "service.name": "my_app",
    }
)
trace.set_tracer_provider(TracerProvider(resource=resource))
tracer = trace.get_tracer(__name__)
span_processor = SimpleSpanProcessor(otlp_exporter)
trace.get_tracer_provider().add_span_processor(span_processor)

SQLAlchemyInstrumentor().instrument(enable_commenter=True, commenter_options={})


# DISCLAIMER:
# This is a very simple CRUD API
# Not intended for production


engine = create_engine(DATABASE_URL)
Session = sessionmaker(bind=engine)


def recreate_database():
    # Base.metadata.drop_all(engine)
    Base.metadata.create_all(engine)


recreate_database()

app = FastAPI()
FastAPIInstrumentor.instrument_app(app)


@app.get("/")
def root():
    return {"message": "Sample books API is online"}


@app.post("/books")
def create_book(title: str, pages: int):
    logger.debug("Creating a new book")
    session = Session()
    book = Book(title=title, pages=pages, created_at=date.today())
    session.add(book)
    session.commit()
    session.close()

    return JSONResponse(
        status_code=200, content={"status_code": 200, "message": "success"}
    )


@app.get("/books/{id}")
def find_book(id: int):
    session = Session()
    book = session.query(Book).filter(Book.id == id).first()
    session.close()

    result = jsonable_encoder({"book": book})

    return JSONResponse(status_code=200, content={"status_code": 200, "result": result})


@app.get("/books")
def get_books(page_size: int = 10, page: int = 1):
    logger.debug("Getting all the books")
    if page_size > 100 or page_size < 0:
        page_size = 100

    session = Session()
    books = session.query(Book).limit(page_size).offset((page - 1) * page_size).all()
    session.close()

    result = jsonable_encoder({"books": books})

    return JSONResponse(status_code=200, content={"status_code": 200, "result": result})


@app.put("/books")
def update_book(id: int, title: Optional[str] = None, pages: Optional[int] = None):
    session = Session()
    book = session.query(Book).get(id)
    if title is not None:
        book.title = title
    if pages is not None:
        book.pages = pages
    session.commit()
    session.close()

    return JSONResponse(
        status_code=200, content={"status_code": 200, "message": "success"}
    )


@app.delete("/books")
def delete_book(id: int):
    session = Session()
    book = session.query(Book).get(id)
    session.delete(book)
    session.commit()
    session.close()

    return JSONResponse(
        status_code=200, content={"status_code": 200, "message": "success"}
    )


@app.exception_handler(Exception)
def exception_handler(request, exc):
    json_resp = get_default_error_response()
    return json_resp


def get_default_error_response(status_code=500, message="Internal Server Error"):
    logger.error(message)
    return JSONResponse(
        status_code=status_code,
        content={"status_code": status_code, "message": message},
    )
The last example contains the main.py file, this is the repo again with the complete code context. In the next part I will explain the code related with the instrumentation, OpenTelemetry and the collector.
Instrumentation
Instrumentation is the process to collect the telemetry data from different parts of the code, big frameworks and tools already have a library to do that, FastAPI and SQLAlchemy are not the exception. The next code contains the instrumentation from the file main.py.
from datetime import date
from typing import Optional
import logging
from fastapi import FastAPI
from fastapi.encoders import jsonable_encoder
from fastapi.responses import JSONResponse
from sqlalchemy import create_engine
from sqlalchemy.orm import sessionmaker

from app.models import Base, Book
from app.settings import DATABASE_URL
from opentelemetry.instrumentation.fastapi import FastAPIInstrumentor
from opentelemetry.instrumentation.sqlalchemy import SQLAlchemyInstrumentor
from opentelemetry import trace
from opentelemetry.sdk.trace import TracerProvider
from opentelemetry.sdk.trace.export import SimpleSpanProcessor
from opentelemetry.exporter.otlp.proto.grpc.trace_exporter import OTLPSpanExporter
from opentelemetry.sdk.resources import Resource


SQLAlchemyInstrumentor().instrument(enable_commenter=True, commenter_options={})


engine = create_engine(DATABASE_URL)
Session = sessionmaker(bind=engine)


def recreate_database():
    # Base.metadata.drop_all(engine)
    Base.metadata.create_all(engine)


recreate_database()

app = FastAPI()
FastAPIInstrumentor.instrument_app(app)


@app.get("/")
def root():
    return {"message": "Sample books API is online"}


@app.post("/books")
def create_book(title: str, pages: int):
    logger.debug("Creating a new book")
    session = Session()
    book = Book(title=title, pages=pages, created_at=date.today())
    session.add(book)
    session.commit()
    session.close()

    return JSONResponse(
        status_code=200, content={"status_code": 200, "message": "success"}
    )
The more important lines are the lines 23 and 38
SQLAlchemyInstrumentor().instrument(enable_commenter=True, commenter_options={})

app = FastAPI()
FastAPIInstrumentor.instrument_app(app)
Line 23 is responsible for instrumenting everything related to SQLAlchemy, while line 38 is responsible for instrumenting everything related to FastAPI. By using these lines of code, OpenTelemetry will send metrics related to HTTP calls, connections to MySQL or PostgreSQL, SQL queries executed, and much more.
Exporter
By default, OpenTelemetry does not export metrics to OTEL Collector, therefore the library opentelemetry-exporter-otlp-proto-grpc need to be installed (poetry add opentelemetry-exporter-otlp-proto-grpc) and the next code need to be set up
from datetime import date
from typing import Optional
import logging
from fastapi import FastAPI
from fastapi.encoders import jsonable_encoder
from fastapi.responses import JSONResponse
from sqlalchemy import create_engine
from sqlalchemy.orm import sessionmaker

from app.models import Base, Book
from app.settings import DATABASE_URL
from opentelemetry.instrumentation.fastapi import FastAPIInstrumentor
from opentelemetry.instrumentation.sqlalchemy import SQLAlchemyInstrumentor
from opentelemetry import trace
from opentelemetry.sdk.trace import TracerProvider
from opentelemetry.sdk.trace.export import SimpleSpanProcessor
from opentelemetry.exporter.otlp.proto.grpc.trace_exporter import OTLPSpanExporter
from opentelemetry.sdk.resources import Resource


otlp_exporter = OTLPSpanExporter(endpoint="localhost:4317", insecure=True)
resource = Resource.create(
    {
        "service.name": "my_app",
    }
)
trace.set_tracer_provider(TracerProvider(resource=resource))
tracer = trace.get_tracer(__name__)
span_processor = SimpleSpanProcessor(otlp_exporter)
trace.get_tracer_provider().add_span_processor(span_processor)
The code line from 22 to 27 are initializing the OTLP protocol to connect with the otel-collector, using the port 4317 and allowing insecure connections, the resource is adding a new metadata which will be used in Elastic APM Cloud to visualize the service
The code line from 28 to 31 are setting the trace to OTLP protocol, the tracer is an abstraction class to management tracing in open telemetry, traces give us the big picture of what happens when a request is made to an application. Whether your application is a monolith with a single database or a sophisticated mesh of services, traces are essential to understanding the full “path” a request takes in your application.
Otel collector
What is a collector by Open telemetry docs: The OpenTelemetry Collector offers a vendor-agnostic implementation of how to receive, process and export telemetry data. It removes the need to run, operate, and maintain multiple agents/collectors. The goal of the OTEL collector is to receive telemetry data and send it to different destinations. Even though this data can be sent directly to Elastic APM Cloud, it is always a better practice to have a collector. The OTEL collector can run using Docker; it will need a config file to specify certain configurations.
receivers:
  otlp:
    protocols:
      grpc:
        endpoint: 0.0.0.0:4317

processors:
  batch:
    timeout: 1s
    send_batch_size: 1024

exporters:
  logging:
    loglevel: debug
  otlphttp/elastic:
    endpoint: "https://your_url"
    headers:
      Authorization: "Bearer your_token"

service:
  pipelines:
    metrics:
      receivers: [otlp]
      exporters: [logging, otlphttp/elastic]
    traces:
      receivers: [otlp]
      exporters: [logging, otlphttp/elastic]
    logs:
      receivers: [otlp]
exporters: [logging,otlphttp/elastic]The 'Receivers' section indicates how the data will be received. There are two options: HTTP and gRPC. The current example uses gRPC, and the reason for this choice is that the SDK in Python uses it by default. If you would like to change to HTTP, you will need to use the following variables.
OTEL_EXPORTER_OTLP_PROTOCOL OTEL_EXPORTER_OTLP_TRACES_PROTOCOL OTEL_EXPORTER_OTLP_METRICS_PROTOCOL OTEL_EXPORTER_OTLP_LOGS_PROTOCOLThe 'Exporters' section determines where the telemetry data will be sent. In our example, it is being sent to the Elastic APM Cloud. However, there are different export options to set up. An important thing to note is to use 'otlphttp/elastic'. In my experience, 'otlp/elastic' didn't work well.
The 'Service' section orchestrates the data defined earlier. In this context, the received and imported telemetry data is located. Metrics, logs, and traces are the pillars of telemetry data, and they will be exported to both logging (meaning they will appear in the console while the otel-collector is running) and to 'otlphttp/elastic'
Running otel-collector using Docker
The easiest way to run otel-colector is using docker, a good practice is to define a docker-compose file to orchestrate everything, but that is content for another article. The following command will run an otel-collector image using the collector-config.yaml defined above.
docker run -p 4317:4317 -v collector-config.yaml:/etc/otel-collector-config.yaml otel/opentelemetry-collector:latest --config=/etc/otel-collector-config.yamlElastic APM Cloud: Last component
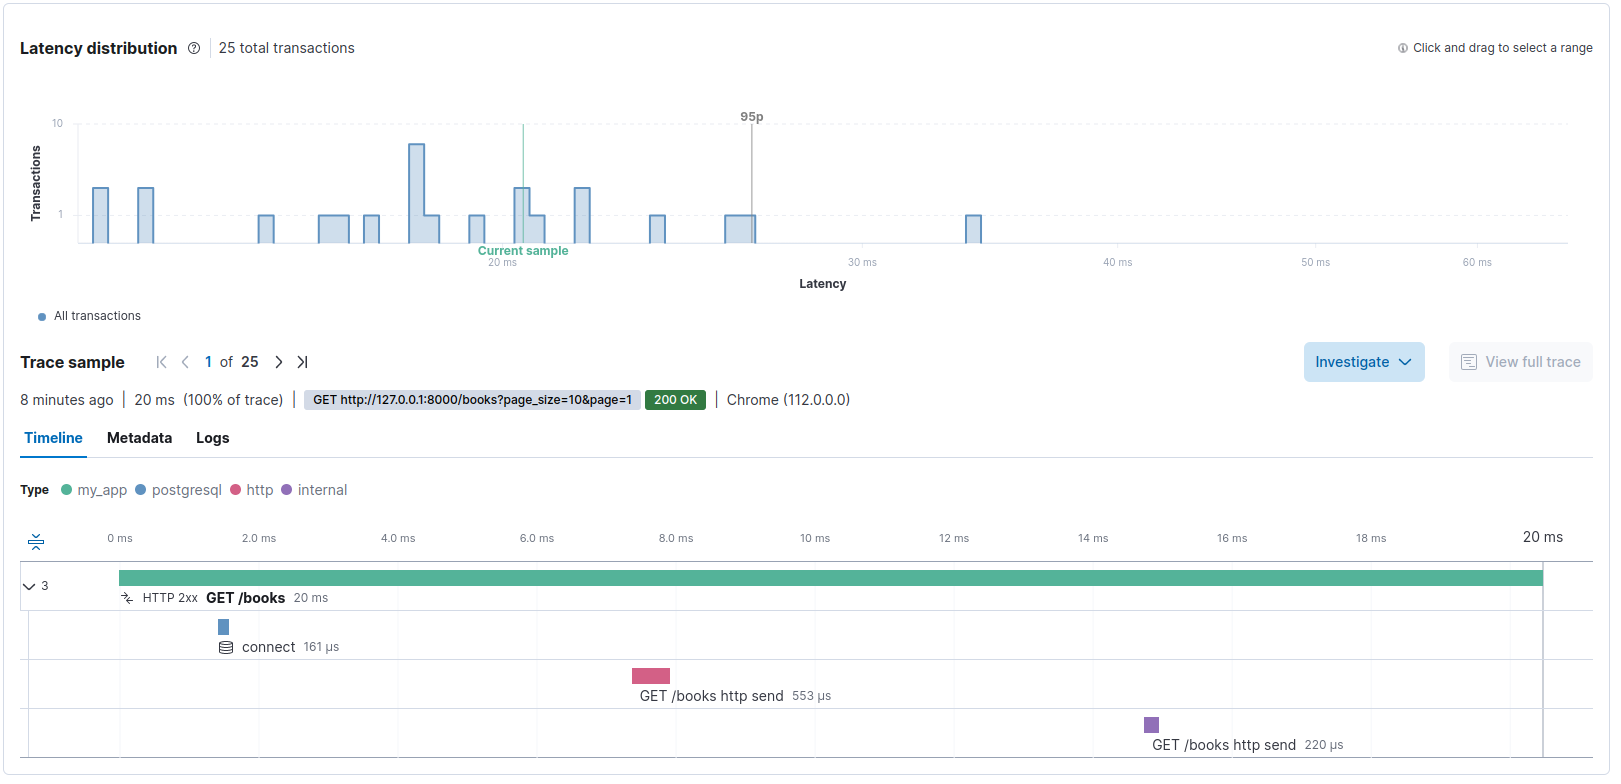
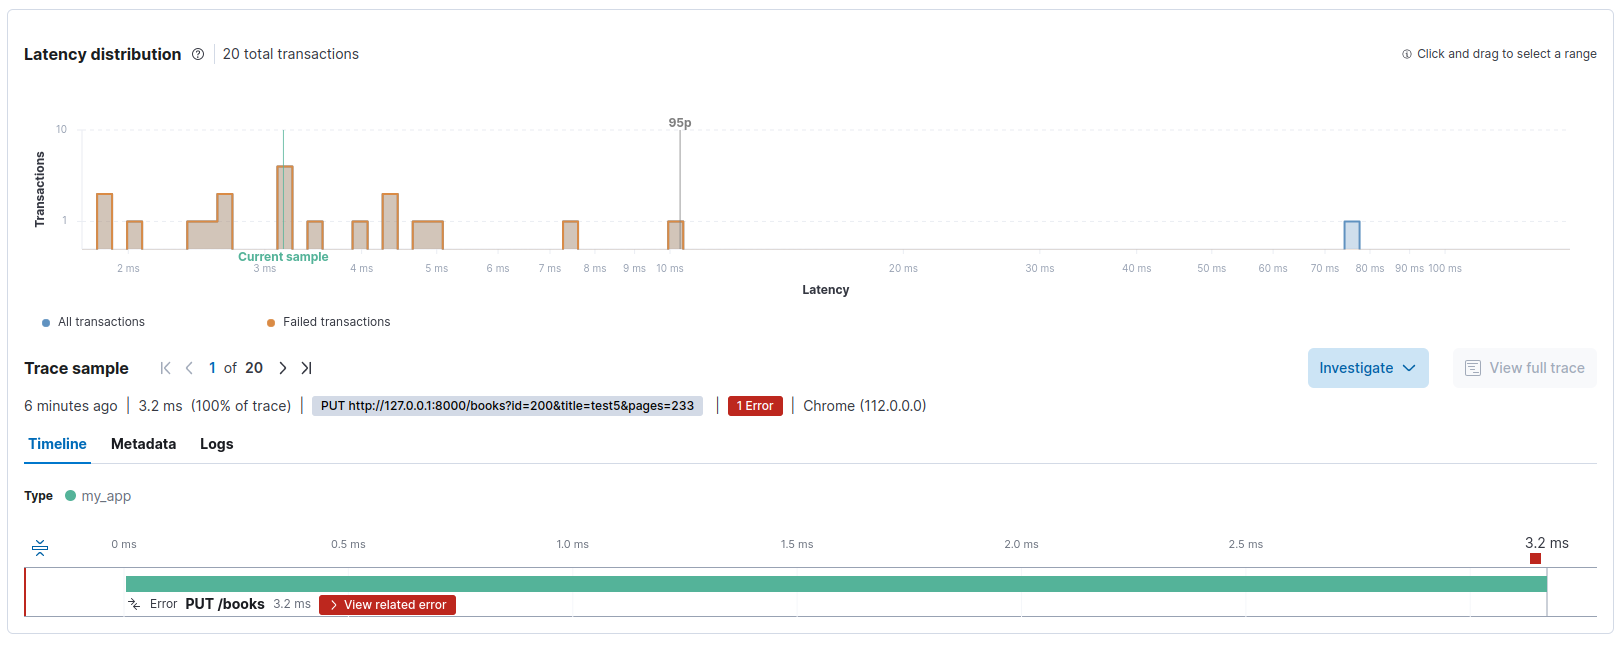
The last stage is to visualize the information using Elastic APM Cloud, but also in console due to the exporters defined above, the following are examples from otel-collector console and Elastic APM cloud
File "/observality/books-crud-fastapi/app/main.py", line 109, in update_book
    raise Exception("testing")
Exception: testing
)
          -> exception.escaped: Str(False)
        {"kind": "exporter", "data_type": "traces", "name": "logging"}
2023-08-07T18:56:34.150Z        info    ResourceSpans #0
Resource SchemaURL:
Resource attributes:
     -> telemetry.sdk.language: Str(python)
     -> telemetry.sdk.name: Str(opentelemetry)
     -> telemetry.sdk.version: Str(1.19.0)
     -> service.name: Str(my_app)
ScopeSpans #0
ScopeSpans SchemaURL:
InstrumentationScope opentelemetry.instrumentation.asgi 0.40b0
Span #0
    Trace ID       : ca067c9bed007c89efc85
    Parent ID      :
    ID             : 7e37b923fd66bd0f
    Name           : PUT /books
    Kind           : Server
    Start time     : 2023-08-07 18:56:34.145470761 +0000 UTC
    End time       : 2023-08-07 18:56:34.148642364 +0000 UTC
    Status code    : Error
    Status message : Exception: testing
Attributes:
     -> http.scheme: Str(http)
     -> http.host: Str(127.0.0.1:8000)
     -> net.host.port: Int(8000)
     -> http.flavor: Str(1.1)
     -> http.target: Str(/books)
     -> http.url: Str(http://127.0.0.1:8000/books?id=200&title=test5&pages=233)
     -> http.method: Str(PUT)
     -> http.server_name: Str(127.0.0.1:8000)
     -> http.user_agent: Str(Test)
     -> net.peer.ip: Str(127.0.0.1)
     -> net.peer.port: Int(34608)
     -> http.route: Str(/books)
Events:
SpanEvent #0
     -> Name: exception
     -> Timestamp: 2023-08-07 18:56:34.148615107 +0000 UTC
     -> DroppedAttributesCount: 0
     -> Attributes::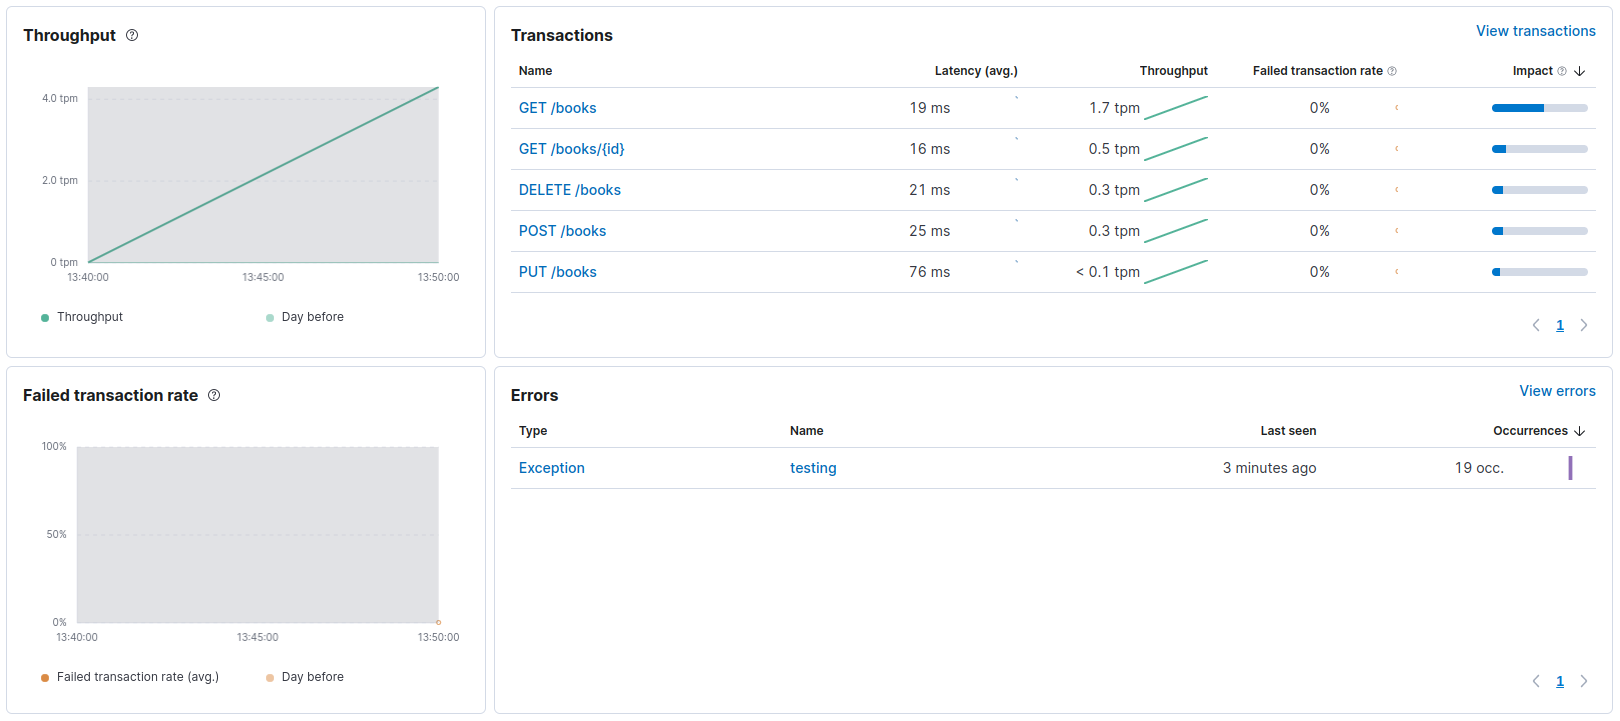
Conclusion
Elastic APM Cloud, Open Telemetry and OTEL make a wonderful stack to support observability, however there are different stacks which can be mixed using different services such as Datadog and sentry, in my experience the cost plays a crucial role, remember technology is always about trade-off, make sure that the solution is affordable and good enough (observability services can end up being so expensive).
Mentions
Thanks to jeremyleonardo for shared his FastAPI project on GitHub